HWWI Dashboard – explore our data
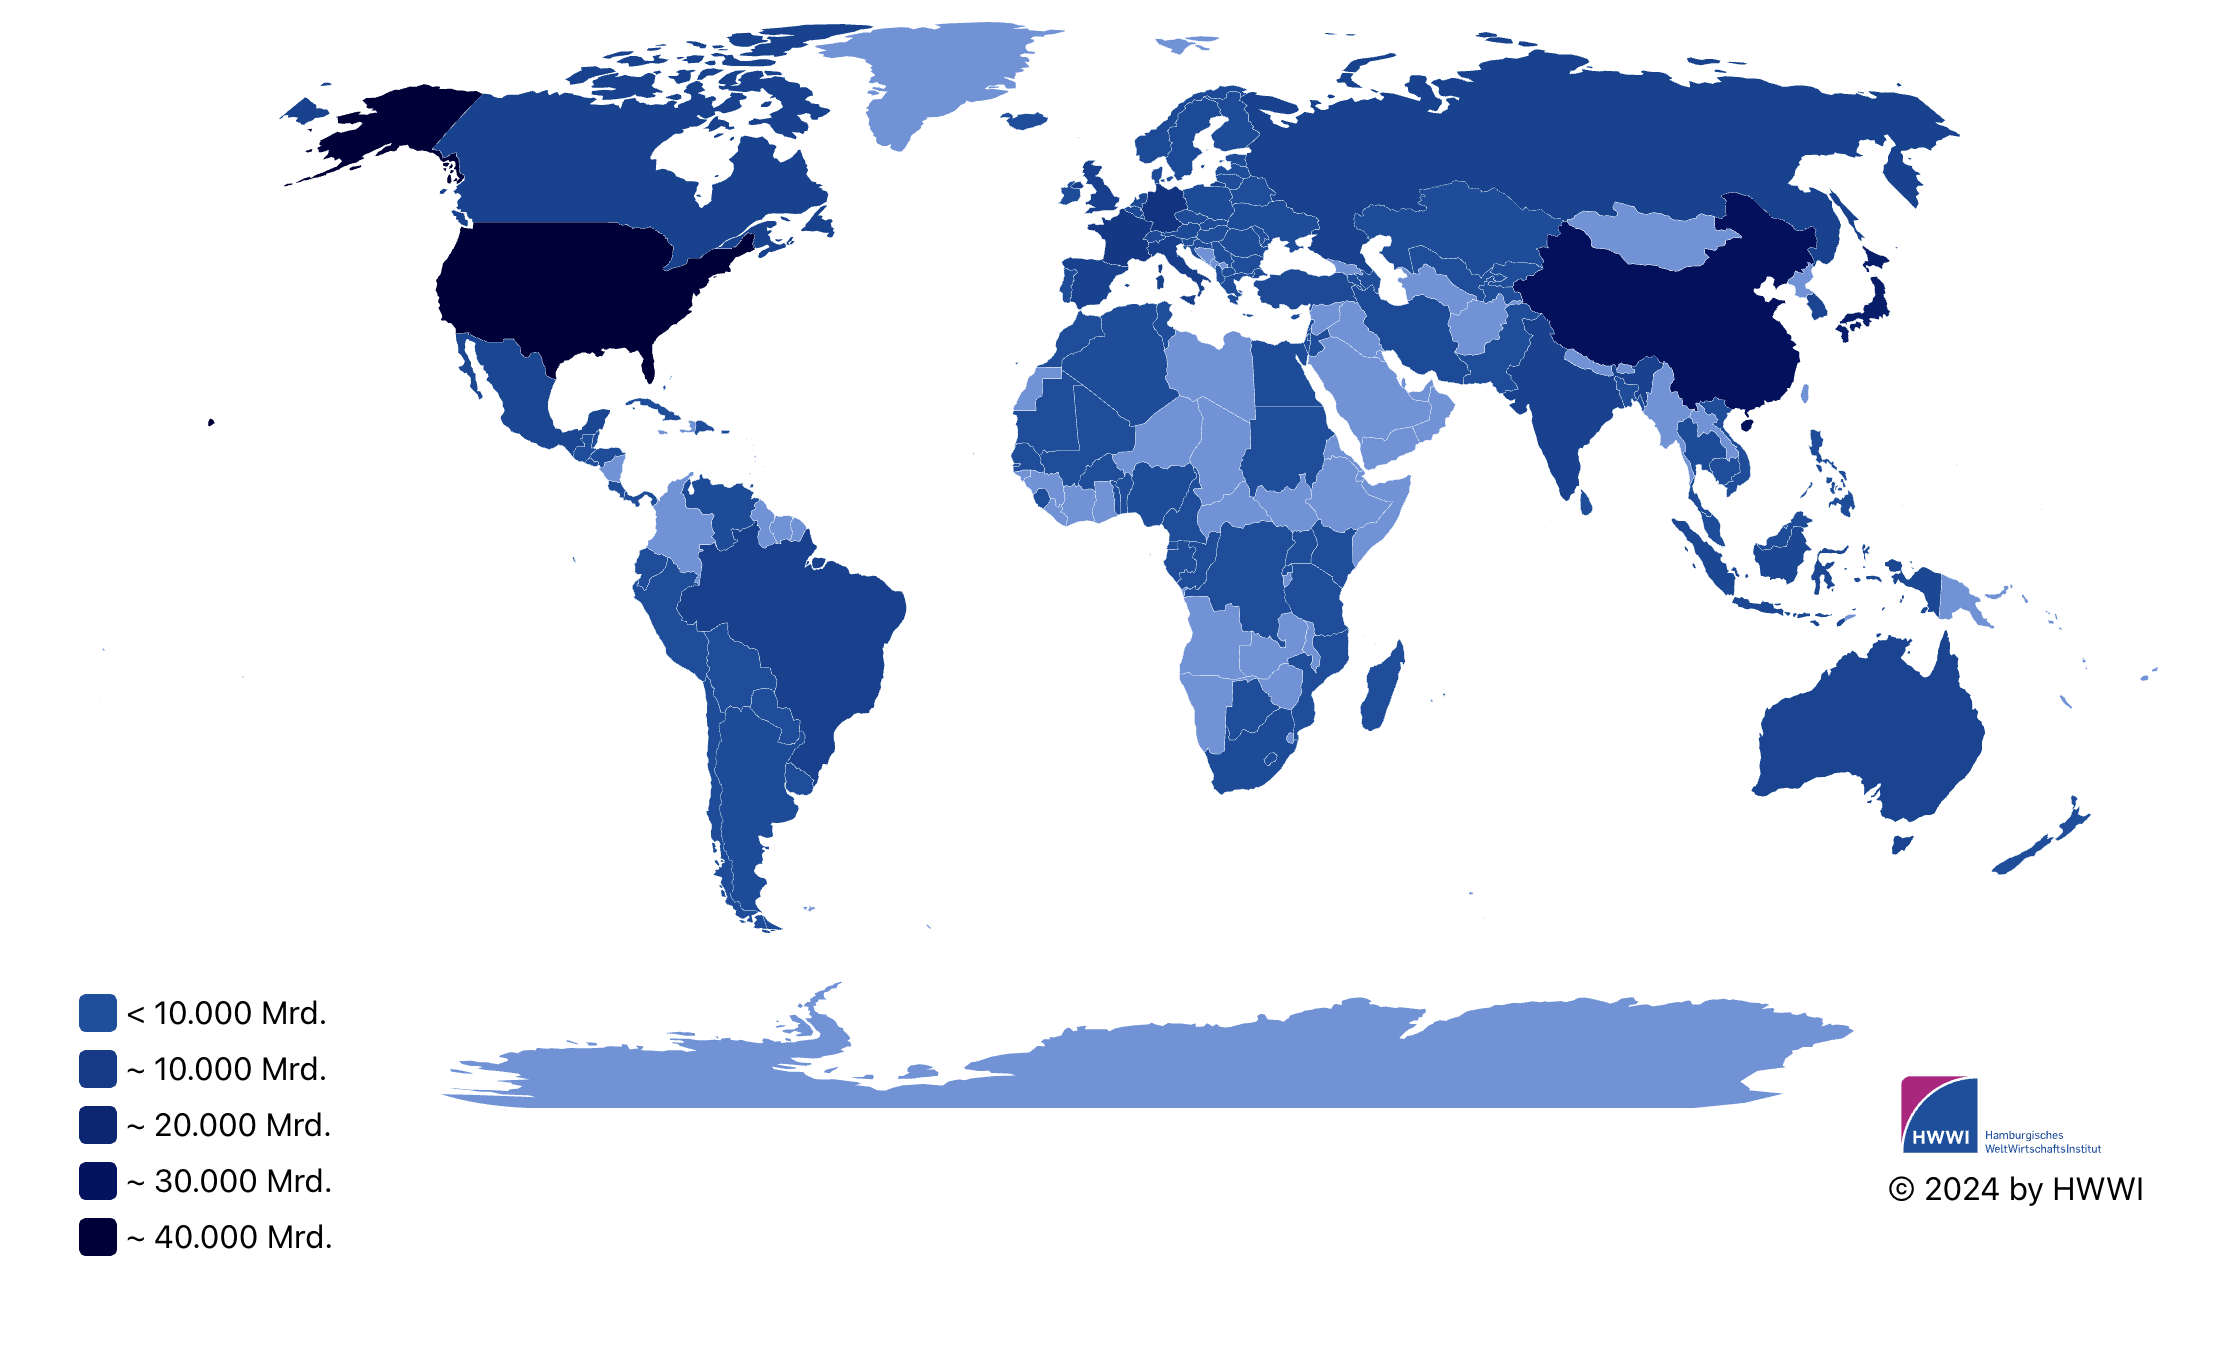
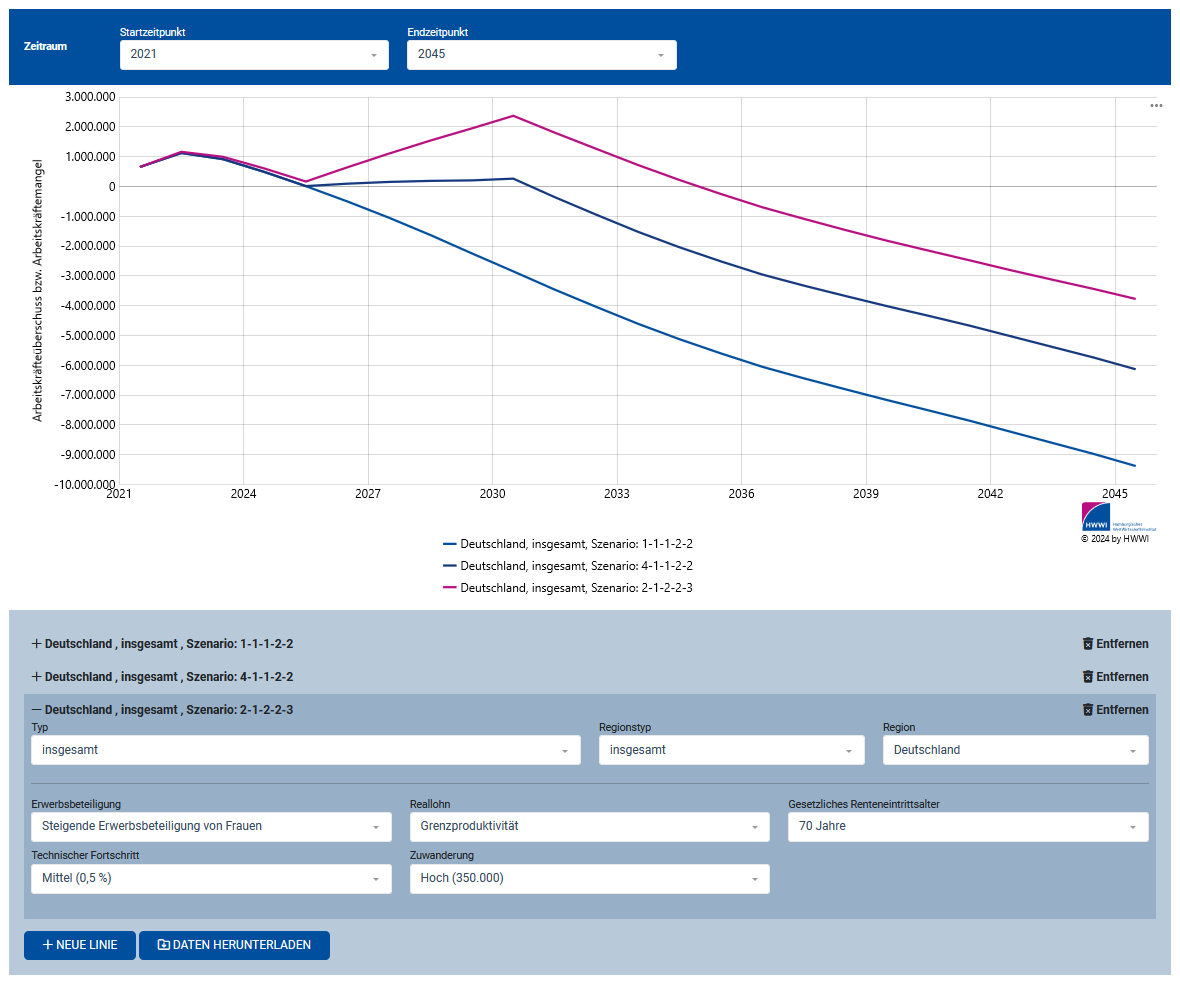
HWWI is a research research institute working primarily empirically. The HWWI's research activities regularly generate data sets that may also be of interest to external researchers and research institutions, companies, associations or politicians. We make such data sets available via our HWWI Dashboard. On the one hand, the dashboard makes it possible to visualize the data in different ways. On the other hand, the dashboard also allows you to download the data. Some of the data is available to download free of charge, while other data requires a paid subscription.
On the one hand, the dashboard provides the option of visualizing the data in various display modes. On the other hand, the dashboard also allows you to download the data. Some of the data is available to download free of charge, while other data requires a paid subscription.

Registration for
data access
Already the free registration
gives you access to extensive download options for our charts and data.


