

HWWI-Commodity Price Index remains volatile: US-Iran MoU provides only temporary relief
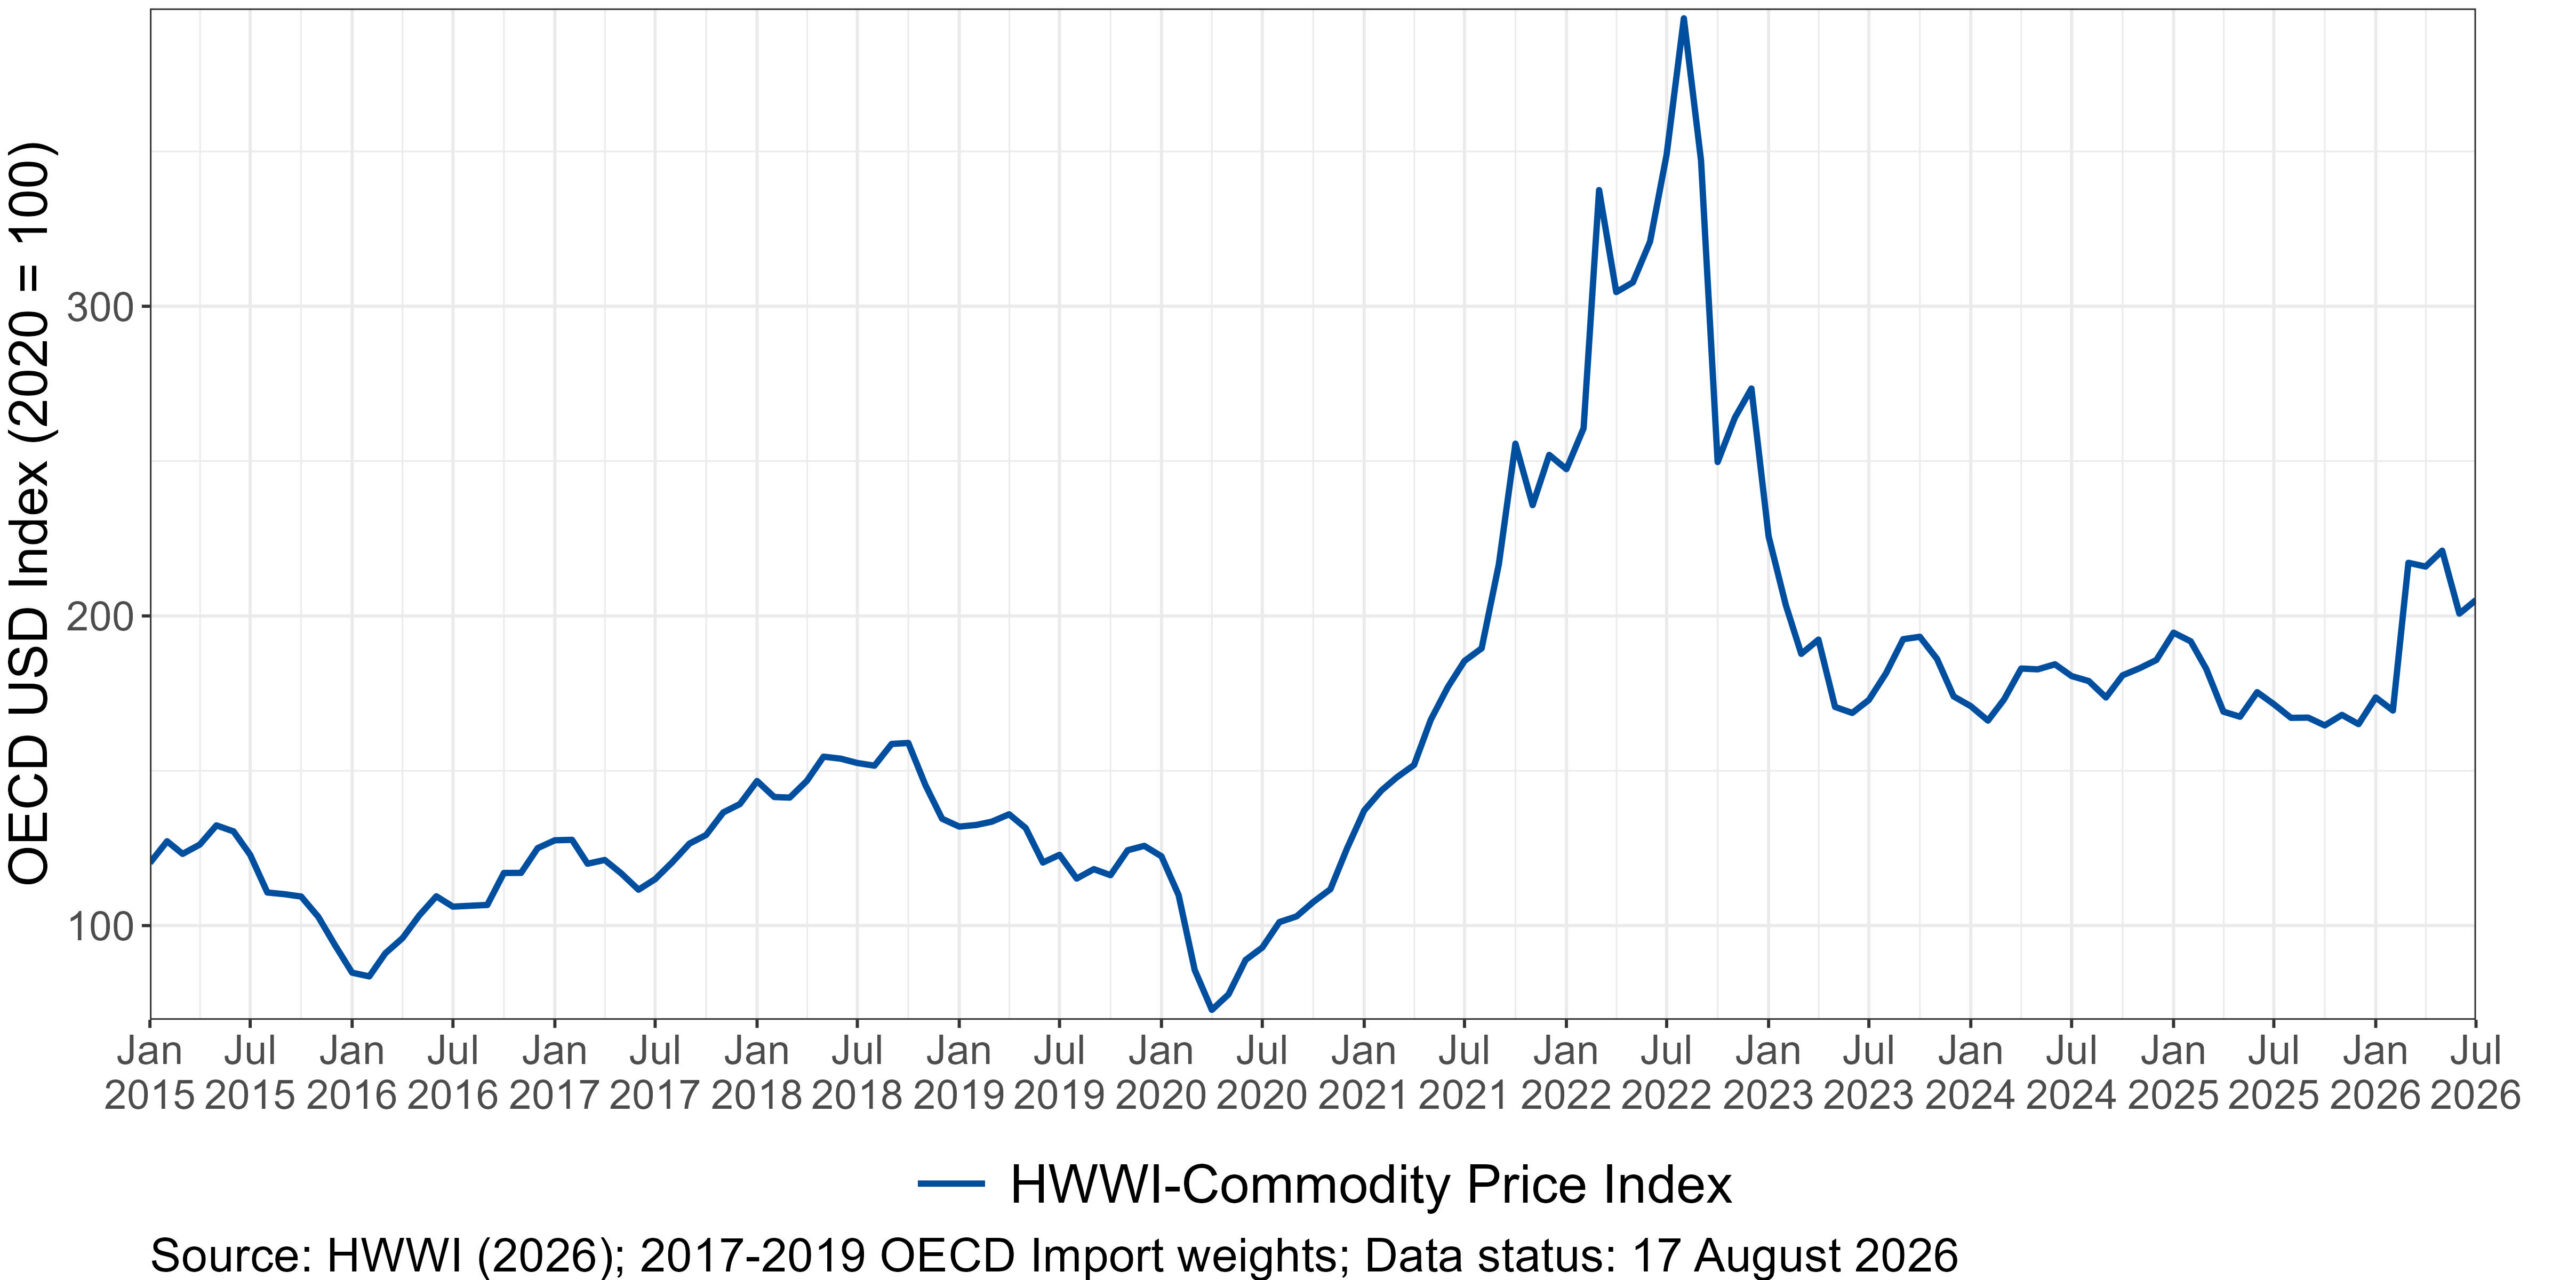
In recent months, the HWWI-Commodity Price Index has shown strong volatility. In May, the total index recorded a further increase of 2.4 %. The following month brought temporary relief as the index fell noticeably by -9.2 % in June. Here, the negotiated US-Iran MoU is likely to have eased market tensions. However, this stabilization did not last: driven by the renewed resurgence of the conflict, prices picked up again by 2.2 % in July. Despite the intermittent fluctuations and the decline in the early summer, the markets reflect the ongoing geopolitical risks: in July, the overall HWWI-Commodity Price Index remained a significant 19.6 % higher than the corresponding figure for the previous year (as of August 17, 2026).
The slight increase in the HWWI-Commodity Price Index in May is due to a moderate rise across all sub-indices. In that month, the food index grew by 3.8 %, followed by the index for industrial raw materials with a plus of 3.6 %, and the index for energy raw materials, which rose by 2.0 %.
The noticeable relief in June was primarily driven by a sharp decline in the energy sector, where the index dropped by -11.3 %; nevertheless, the index for energy raw materials remained 17.9 % higher than in the same month of the previous year. This development in June was accompanied by falling values in the food index (-3.9 %) as well as the index for industrial raw materials (-2.1 %).
In July, the HWWI-Commodity Price Index rose slightly once again, driven primarily by a strong 11.4 % increase in food prices. This was offset by a decline in industrial raw materials, which fell by -3.2 %, while energy prices rose again by 2.3 % in July.
Within the index for energy raw materials, individual energy sources showed mixed performance during the reporting period. In May, natural gas prices initially rose, leading to a 5.0 % increase in the corresponding subindex. June was then characterized by mixed price movements for natural gas, as U.S. prices rose while European prices fell. In July, however, European natural gas prices recorded a sharp jump of 19.2 %, whereas U.S. gas prices fell by -7.8 %.
Coal prices recorded a significant decline of -10.0 % in July, after having risen in the preceding months. Crude oil prices showed a very slight upward trend in May, with WTI being the only exception. This was followed in June by a sharp decline across all crude oil grades, with Brent falling by as much as 18.6 %. In July, the downward trend continued at a slower pace, resulting in only a slight decline across all grades.
The food index initially recorded growth in May, driven in particular by a sharp 22.1 % increase in the price of cocoa. Falling prices for palm oil and coconut oil were primarily responsible for the temporary relief in June. In July, however, the trend reversed, and the index shot up by 11.4 %, settling at 3.7 % above the level of the same month the previous year. This marked upward trend in July was once again the result of a rise in cocoa prices (27.7 %), but this time it was additionally driven by palm oil, as well as rice and wheat, all of which recorded double-digit growth rates.
The index for industrial raw materials initially recorded a gain in May, which was primarily driven by rising prices for tin and cotton. In June, however, there was a trend reversal and a decline in the index, for which falling quotes for cotton and iron ore were mainly responsible. This downward trend continued in July, with falling prices for aluminum being the decisive factor for the renewed decrease this month.